I’m starting off 2021 with my 99th post ever to introduce a new feature that will be incorporated into simstudy soon to make it a bit easier to generate ordinal data without requiring an assumption of proportional odds. I should wait until this feature has been incorporated into the development version, but I want to put it out there in case any one has any further suggestions. In any case, having this out in plain view will motivate me to get back to work on the package.
In the past, I have generated ordinal without the non-proportional odds assumption, but it was a bit cumbersome. I’ve wanted to simplify the approach by incorporating the functionality directly into genOrdCat. While this last step is not complete, it is very close. For now, there is a temporary function genOrdCatNP.
Starting with the proportional odds assumption
First, I am generating a data set using genOrdCat and an assumption of proportionality. This will be a large data set to eliminate any sampling issues when summarizing the odds ratios. (Please take a look here for a little more detail on how how the odds and cumulative odds are defined.) The data will include a treatment or exposure indicator and an ordinal categorical outcome with four possible responses. In this case, the log odds-ratio comparing the odds for the treatment group with the control group will be -1.3, which translates to an odds ratio (OR) of 0.27.
d1 <- defDataAdd(varname = "z", formula = "rx * 1.3", dist = "nonrandom")

set.seed(382763)
dd <- genData(100000)
dd <- trtAssign(dd, grpName = "rx")
dd <- addColumns(d1, dd)

baseprobs <- c(.4, .3, .2, .1)
dd_p <- genOrdCat(dtName = dd, adjVar = "z", baseprobs = baseprobs)
Here is a calculation of the cumulative proportions and odds, as well as the odds ratios, which are all close to -1.3:
(prop <- prop.table(dd_p[, table(rx, cat)], 1))## cat
## rx 1 2 3 4
## 0 0.40 0.30 0.20 0.10
## 1 0.15 0.24 0.32 0.29(cumprop <- data.table(apply(prop, 1, cumsum)))## 0 1
## 1: 0.4 0.15
## 2: 0.7 0.39
## 3: 0.9 0.71
## 4: 1.0 1.00(cumodds <- cumprop[, .(odds0 = `0`/(1 - `0`), odds1=`1`/(1 - `1`))])## odds0 odds1
## 1: 0.67 0.18
## 2: 2.32 0.63
## 3: 8.84 2.45
## 4: Inf Infcumodds[1:3, odds1/odds0]## [1] 0.27 0.27 0.28To visualize cumulative proportional odds, here’s a plot using the really nice likert package:
library(likert)

item <- data.frame(dd_p[, "cat"])
names(item) <- "response"
bin.grp <- factor(dd_p[, rx])
likert.bin <- likert(item, grouping = bin.grp)

plot(likert.bin) + ggtitle("Proportional odds")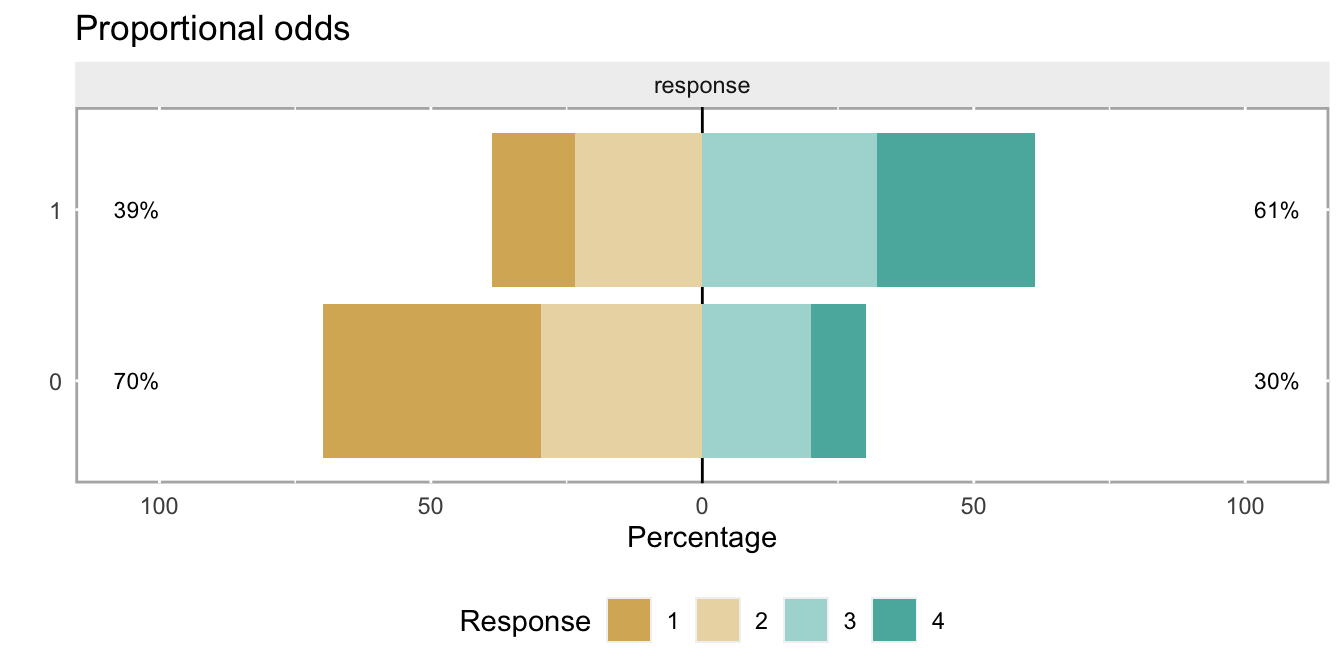
It’s now simple to relax the proportionality assumption
Two arguments are needed to relax the assumption: npVar and npAdj. The user specifies the first argument to indicate what variable is driving the lack of proportionality. In this case, it will be the treatment itself, since that is the only covariate in the data set. The second argument is a vector that represents the violation of the assumption at each level of the ordinal measure. The length of this vector is currently the same length as the number of ordinal categories, though the last value will always be 0.
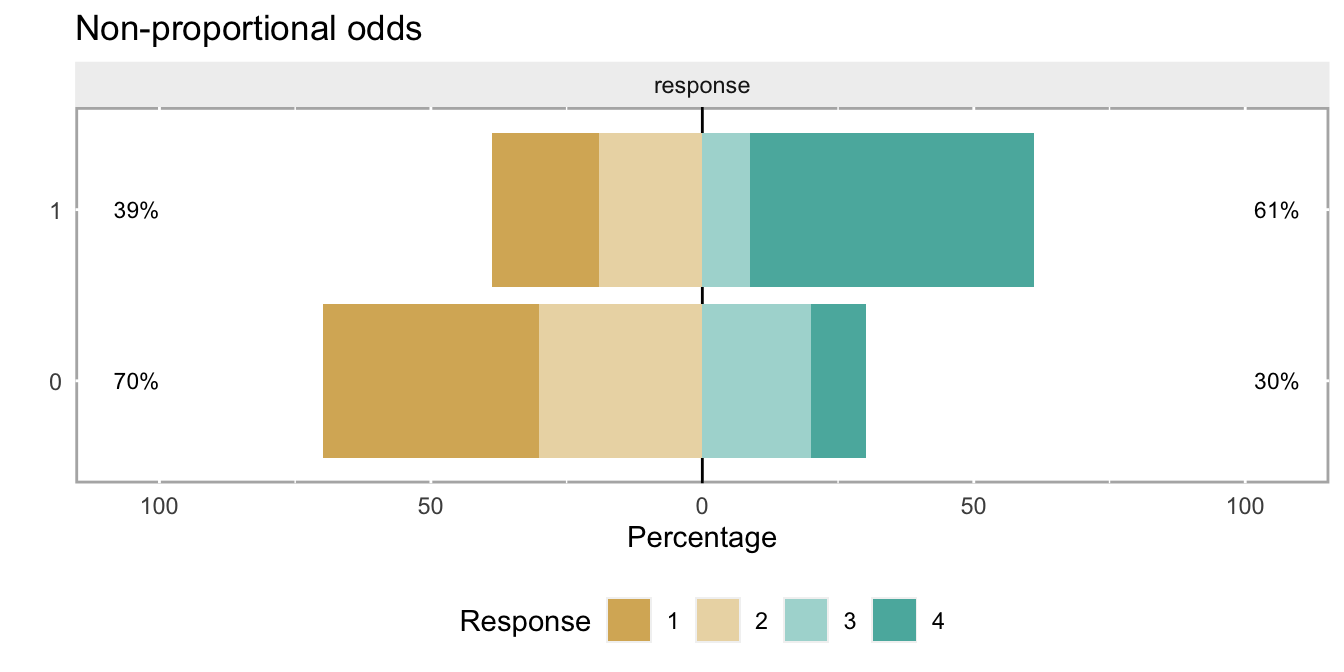
In this example, the cumulative log-odds ratio for the first category will be 0.3 points more than the proportional assumption of -1.3, so should be quite close to -1.0 (or 0.37 on the OR scale). The cumulative log-odds ratio (and OR) for the second category will be the same as in the case of proportionality. And, the cumulative log-odds ratio for the third category will be 1.0 less than -1.3, or around -2.3 (which translates to 0.10 on the OR scale)
npAdj <- c(-0.3, 0.0, 1.0, 0)
dd_np <- genOrdCatNP(dtName = dd, adjVar = "z", baseprobs = baseprobs,
                  npVar = "rx", npAdj = npAdj)

cumprop <- data.table(apply(prop.table(dd_np[, table(rx, cat)], 1), 1, cumsum))
cumodds <- cumprop[, .(odds0 = `0`/(1 - `0`), odds1=`1`/(1 - `1`))]
cumodds[1:3, odds1/odds0]
## [1] 0.37 0.27 0.10And here is what non-proportional cumulative odds looks like: